Mazda Reports Record December Sales and Full-Year 2023 Sales Results

Mazda North American Operations (MNAO) today reported total December sales of 39,518 vehicles, an increase of 44.8 percent compared to December 2022. Full-year sales totaled 363,354 vehicles; an increase of 23.2 percent compared to 2022. With 26 selling days in December, compared to 27 the year prior, the company posted an increase of 50.4 percent on a Daily Selling Rate (DSR) basis.

CPO sales totaled 5,130 vehicles in December, an increase of 1.0 percent compared to December 2022.
December 2023 sales highlights include:
- Best December sales ever with 39,518 vehicles sold.
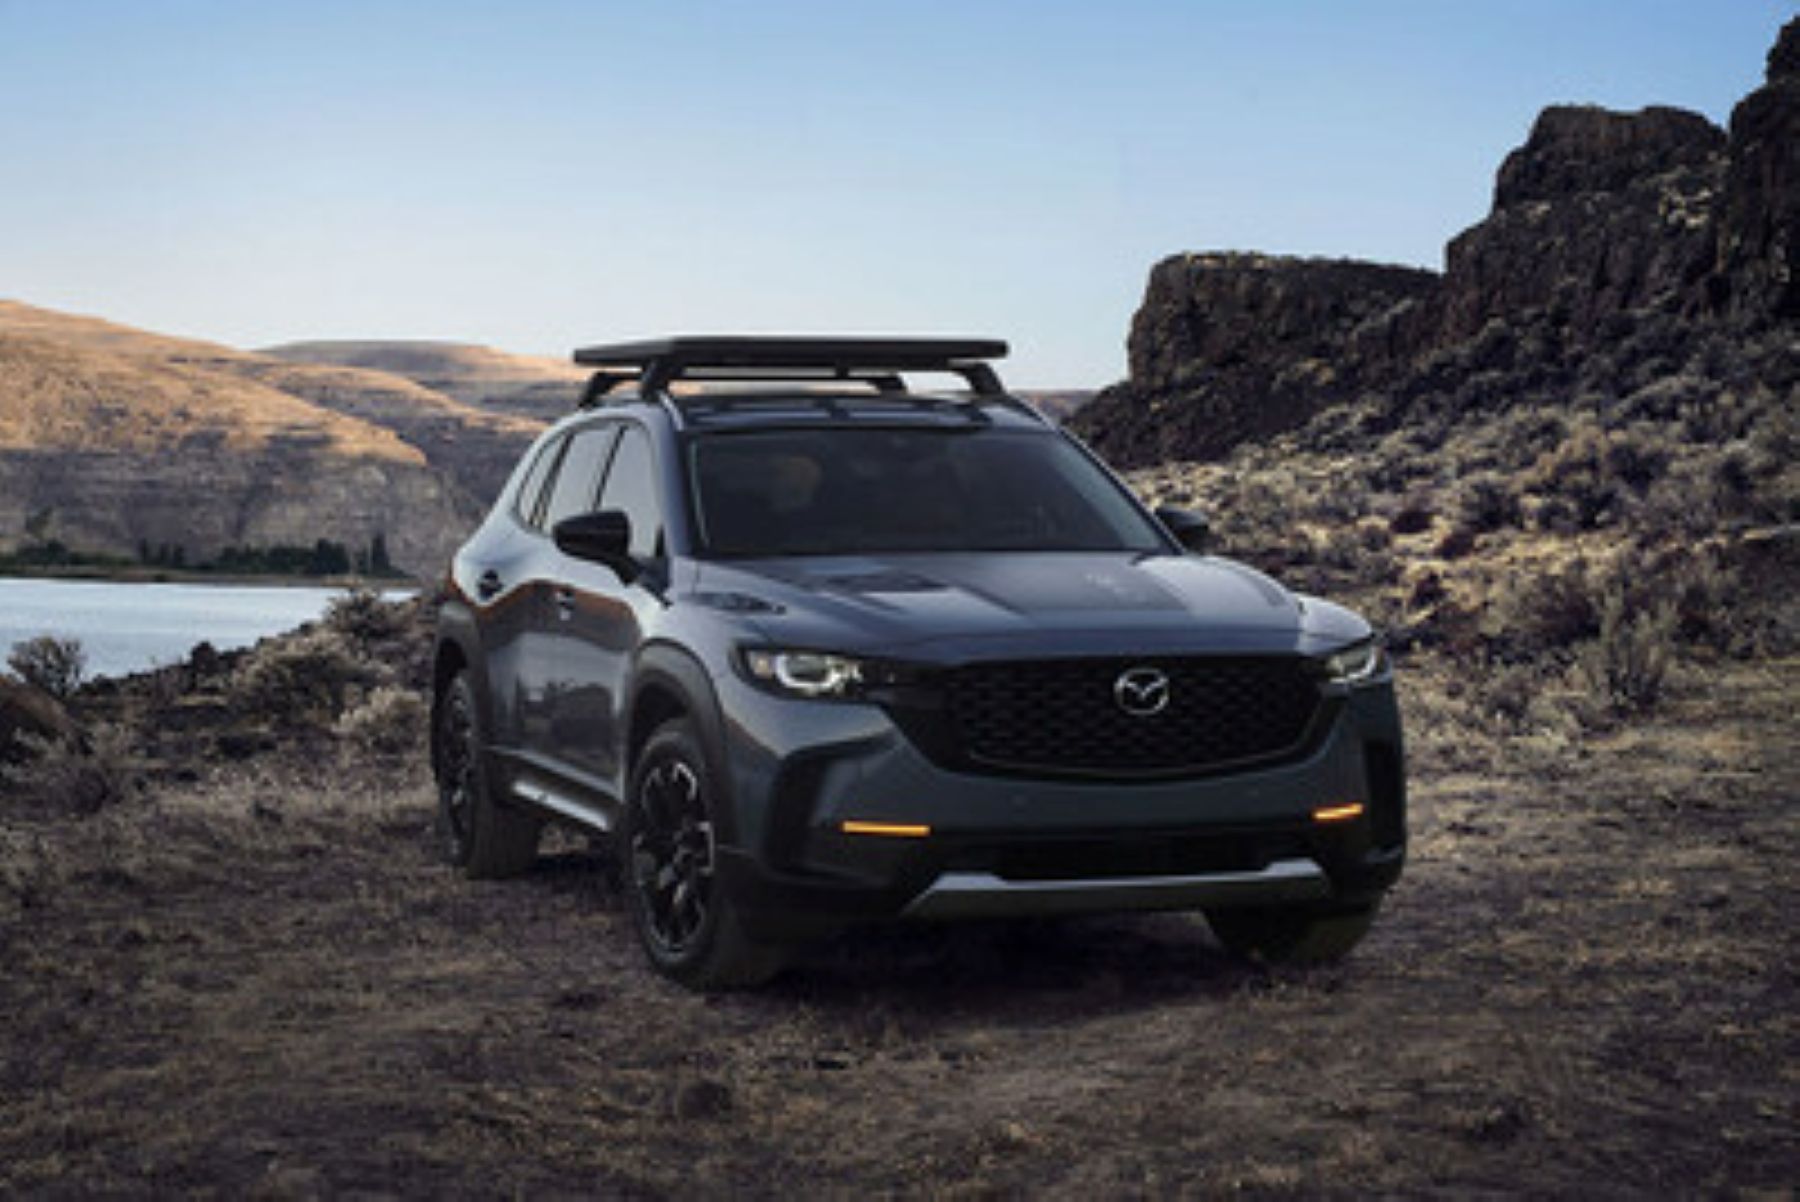
- Best-ever sales of CX-50 with 5,754 vehicles sold.
- Best December sales of CX-5 with 20,434 vehicles sold.
- Best December sales of CX-30 with 5,672 vehicles sold.
In 2023, Mazda achieved many milestones in the US, including:
- The CX-90 Inline 6 and PHEV began sales in the U.S. in March and has received numerous accolades including Good Housekeeping 2024 Family Travel Award.
- In April, Tom Donnelly became MNAO’s President and CEO.
- Mazda Toyota Manufacturing located in Huntsville, AL, celebrated its fifth anniversary in November.
- In early 2023, all tested Mazda vehicles earned the IIHS 2023 TOP SAFETY PICK. These vehicles included the Mazda3 Sedan, Mazda3 Hatchback, CX-30, CX-5, CX-9, and CX-50.
- Over the summer we held the very first crash test of 2024 CX-90 in the U.S., earning it IIHS’s top-tier award, 2023 TOP SAFETY PICK+.
- As the year came to a close, improved pedestrian crash avoidance in 2024 Mazda3 Sedan, Mazda3 Hatchback, and CX-30 earned them upgrades from 2023 TOP SAFETY PICK to TOP SAFETY PICK+.
Mazda Canada, Inc., (MCI) reported December sales of 4,461 vehicles, an increase of 62.9 percent compared to December last year. Full-year 2023 sales increased 17.6 percent, with 58,637 vehicles sold.
Mazda Motor de Mexico (MMdM) reported December sales of 7,304 vehicles, an increase of 2.0 percent compared to last year. Full-year 2023 sales increased 57% percent, with 76,017 vehicles sold.
Mazda North American Operations is headquartered in Irvine, California, and oversees the sales, marketing, parts, and customer service support of Mazda vehicles in the United States, Canada, Mexico, and Colombia through approximately 795 dealers. Operations in Canada are managed by Mazda Canada Inc. in Richmond Hill, Ontario; operations in Mexico are managed by Mazda Motor de Mexico in Mexico City; and operations in Colombia are managed by Mazda de Colombia in Bogota, Colombia. For more information on Mazda vehicles, including photography and B-roll, please visit the online Mazda media center at News.MazdaUSA.com.
Follow @MazdaUSA on social media: Facebook, Instagram, X, YouTube, and Threads.
| Month-To-Date | Year-To-Date | ||||||||||
| December | December | YOY % | % MTD | December | December | YOY % | % MTD | ||||
| 2023 | 2022 | Change | DSR | 2023 | 2022 | Change | DSR | ||||
| Mazda3 | 2,458 | 1,986 | 23.8 % | 28.5 % | 30,531 | 27,767 | 10.0 % | 10.3 % | |||
| Mazda 3 Sdn | 1,435 | 1,202 | 19.4 % | 24.0 % | 17068 | 13,154 | 29.8 % | 30.2 % | |||
| Mazda 3 HB | 1,023 | 784 | 30.5 % | 35.5 % | 13463 | 14,613 | (7.9) % | (7.6) % | |||
| Mazda6 | 0 | 0 | – | – | 0 | 335 | (100.0) % | (100.0) % | |||
| MX-5 Miata | 422 | 738 | (42.8) % | (40.6) % | 8,973 | 6,171 | 45.4 % | 45.9 % | |||
| MX-5 | 156 | 389 | (59.9) % | (58.4) % | 4591 | 2,588 | 77.4 % | 78.0 % | |||
| MXR | 266 | 349 | (23.8) % | (20.9) % | 4382 | 3,583 | 22.3 % | 22.7 % | |||
| CX-3 | – | 0 | – | – | – | 0 | – | – | |||
| CX-30 | 5,672 | 4,298 | 32.0 % | 37.0 % | 77075 | 52,808 | 46.0 % | 46.4 % | |||
| CX-5 | 20,434 | 13,512 | 51.2 % | 57.0 % | 153808 | 151,594 | 1.5 % | 1.8 % | |||
| CX-9 | 2 | 3,695 | (99.9) % | (99.9) % | 17451 | 34,580 | (49.5) % | (49.4) % | |||
| CX-50 | 5,754 | 3,063 | 87.9 % | 95.1 % | 44595 | 21,329 | 109.1 % | 109.8 % | |||
| MX-30 | 0 | 0 | – | – | 100 | 324 | (69.1) % | (69.0) % | |||
| CX-90 | 4,776 | 0 | – | – | 30821 | 0 | – | – | |||
| CARS | 2,880 | 2,724 | 5.7 % | 9.8 % | 39,504 | 34,273 | 15.3 % | 15.6 % | |||
| TRUCKS | 36,638 | 24,568 | 49.1 % | 54.9 % | 323,850 | 260,635 | 24.3 % | 24.7 % | |||
| TOTAL | 39,518 | 27,292 | 44.8 % | 50.4 % | 363,354 | 294,908 | 23.2 % | 23.6 % | |||
| *Selling Days | 26 | 27 | 306 | 307 | |||||||


