


Mazda Reports November Sales Results
Mazda North American Operations (MNAO) today reported total November sales of 27,715 vehicles, an increase of 3 percent compared to November 2022. Year-to-date sales totaled 323,836 vehicles; an increase of 21 percent compared to the same time last year. With 25 selling days in November, compared to the same the year prior, the company posted an increase of 3 percent on a Daily Selling Rate (DSR) basis.

CPO sales totaled 4,677 vehicles in November, an increase of 8 percent compared to November 2022.
Sales Highlights
- Second best November total sales with 27,715 vehicles sold
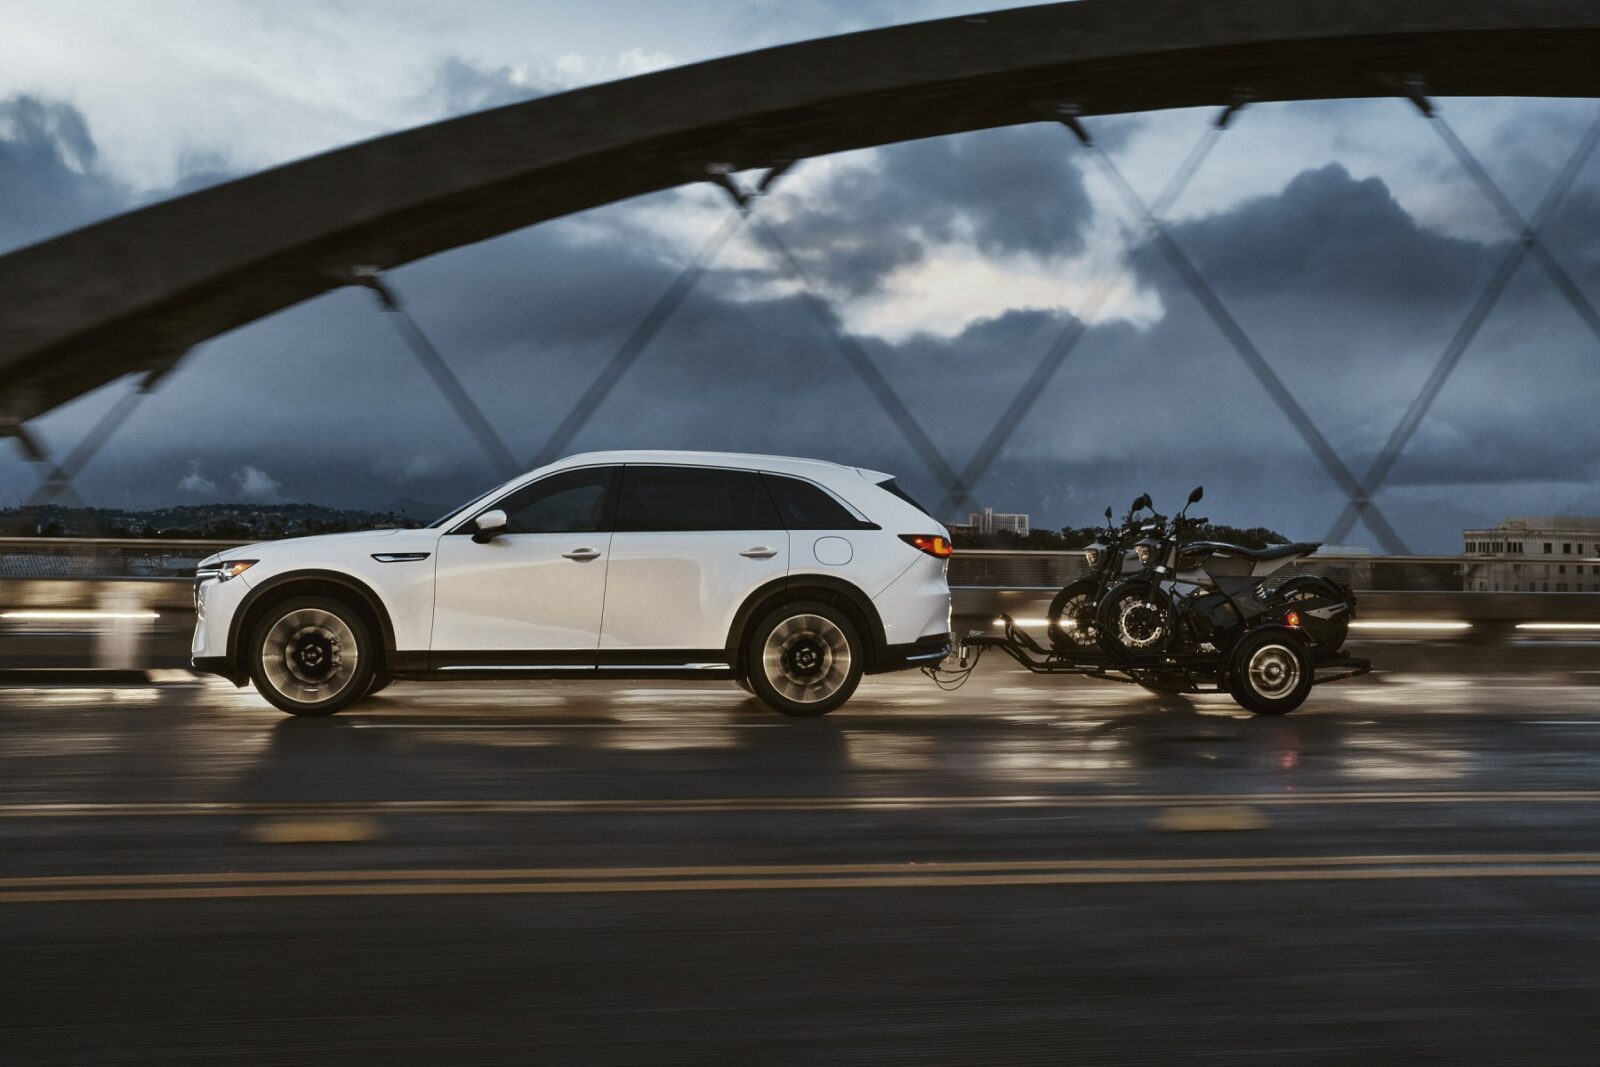
- Best-ever monthly sales of CX-90 with 5,055 vehicles sold
- Best-ever November sales of CX-50 with 3,954 vehicles sold
- Best-ever November sales of CX-30 with 6,193 vehicles sold
Mazda Canada, Inc., (MCI) reported November sales of 4,943 vehicles, an increase of 61.2 percent compared to November last year. Year-to-date sales totaled 54,176 vehicles; an increase of 14.9 percent compared to the same time last year.
Mazda Motor de Mexico (MMdM) reported November sales of 8,607 vehicles, an increase of 109 percent compared to last year. Year-to-date sales totaled 68,713 vehicles; an increase of 67 percent compared to the same time last year.
Mazda North American Operations is headquartered in Irvine, California, and oversees the sales, marketing, parts, and customer service support of Mazda vehicles in the United States, Canada, Mexico, and Colombia through approximately 795 dealers. Operations in Canada are managed by Mazda Canada Inc. in Richmond Hill, Ontario; operations in Mexico are managed by Mazda Motor de Mexico in Mexico City; and operations in Colombia are managed by Mazda de Colombia in Bogota, Colombia. For more information on Mazda vehicles, including photography and B-roll, please visit the online Mazda media center at News.MazdaUSA.com.
Follow @MazdaUSA on social media: Facebook, Instagram, X, YouTube, and Threads.
| Month-To-Date | Year-To-Date | ||||||||||
| November | November | YOY % | % MTD | November | November | YOY % | % MTD | ||||
| 2023 | 2022 | Change | DSR | 2023 | 2022 | Change | DSR | ||||
| Mazda3 | 2,504 | 3,023 | (17.2) % | (17.2) % | 28,073 | 25,781 | 8.9 % | 8.9 % | |||
| Mazda 3 Sdn | 1,415 | 2,124 | (33.4) % | (33.4) % | 15633 | 11,952 | 30.8 % | 30.8 % | |||
| Mazda 3 HB | 1,089 | 899 | 21.1 % | 21.1 % | 12440 | 13,829 | (10.0) % | (10.0) % | |||
| Mazda6 | 0 | 0 | – | – | 0 | 335 | (100.0) % | (100.0) % | |||
| MX-5 Miata | 451 | 449 | 0.4 % | 0.4 % | 8,551 | 5,433 | 57.4 % | 57.4 % | |||
| MX-5 | 182 | 243 | (25.1) % | (25.1) % | 4435 | 2,199 | 101.7 % | 101.7 % | |||
| MXR | 269 | 206 | 30.6 % | 30.6 % | 4116 | 3,234 | 27.3 % | 27.3 % | |||
| CX-3 | – | 0 | – | – | – | 0 | – | – | |||
| CX-30 | 6,193 | 4,457 | 38.9 % | 38.9 % | 71403 | 48,510 | 47.2 % | 47.2 % | |||
| CX-5 | 9,556 | 12,692 | (24.7) % | (24.7) % | 133374 | 138,082 | (3.4) % | (3.4) % | |||
| CX-9 | 2 | 4,025 | (100.0) % | (100.0) % | 17449 | 30,885 | (43.5) % | (43.5) % | |||
| CX-50 | 3,954 | 2,260 | 75.0 % | 75.0 % | 38841 | 18,266 | 112.6 % | 112.6 % | |||
| MX-30 | 0 | 0 | – | – | 100 | 324 | (69.1) % | (69.1) % | |||
| CX-90 | 5,055 | 0 | – | – | 26045 | 0 | – | – | |||
| CARS | 2,955 | 3,472 | (14.9) % | (14.9) % | 36,624 | 31,549 | 16.1 % | 16.1 % | |||
| TRUCKS | 24,760 | 23,434 | 5.7 % | 5.7 % | 287,212 | 236,067 | 21.7 % | 21.7 % | |||
| TOTAL | 27,715 | 26,906 | 3.0 % | 3.0 % | 323,836 | 267,616 | 21.0 % | 21.0 % | |||
| *Selling Days | 25 | 25 | 280 | 280 | |||||||
Got a Questions?
Find us on Socials or Contact us and we’ll get back to you as soon as possible.