Studying the Sun
Science in Space: June 2024
The Sun wields a huge influence on Earth. Its gravity holds our planet in its orbit, and solar energy drives the seasons, ocean currents, weather, climate, radiation belts, and auroras on Earth.
The solar wind, a flow of charged particles from the Sun, constantly bombards Earth’s magnetosphere, a vast magnetic shield around the planet. The Sun occasionally releases massive amounts of energy, creating solar geomagnetic storms that can interfere with communications and navigation and disrupt the electric power grid.
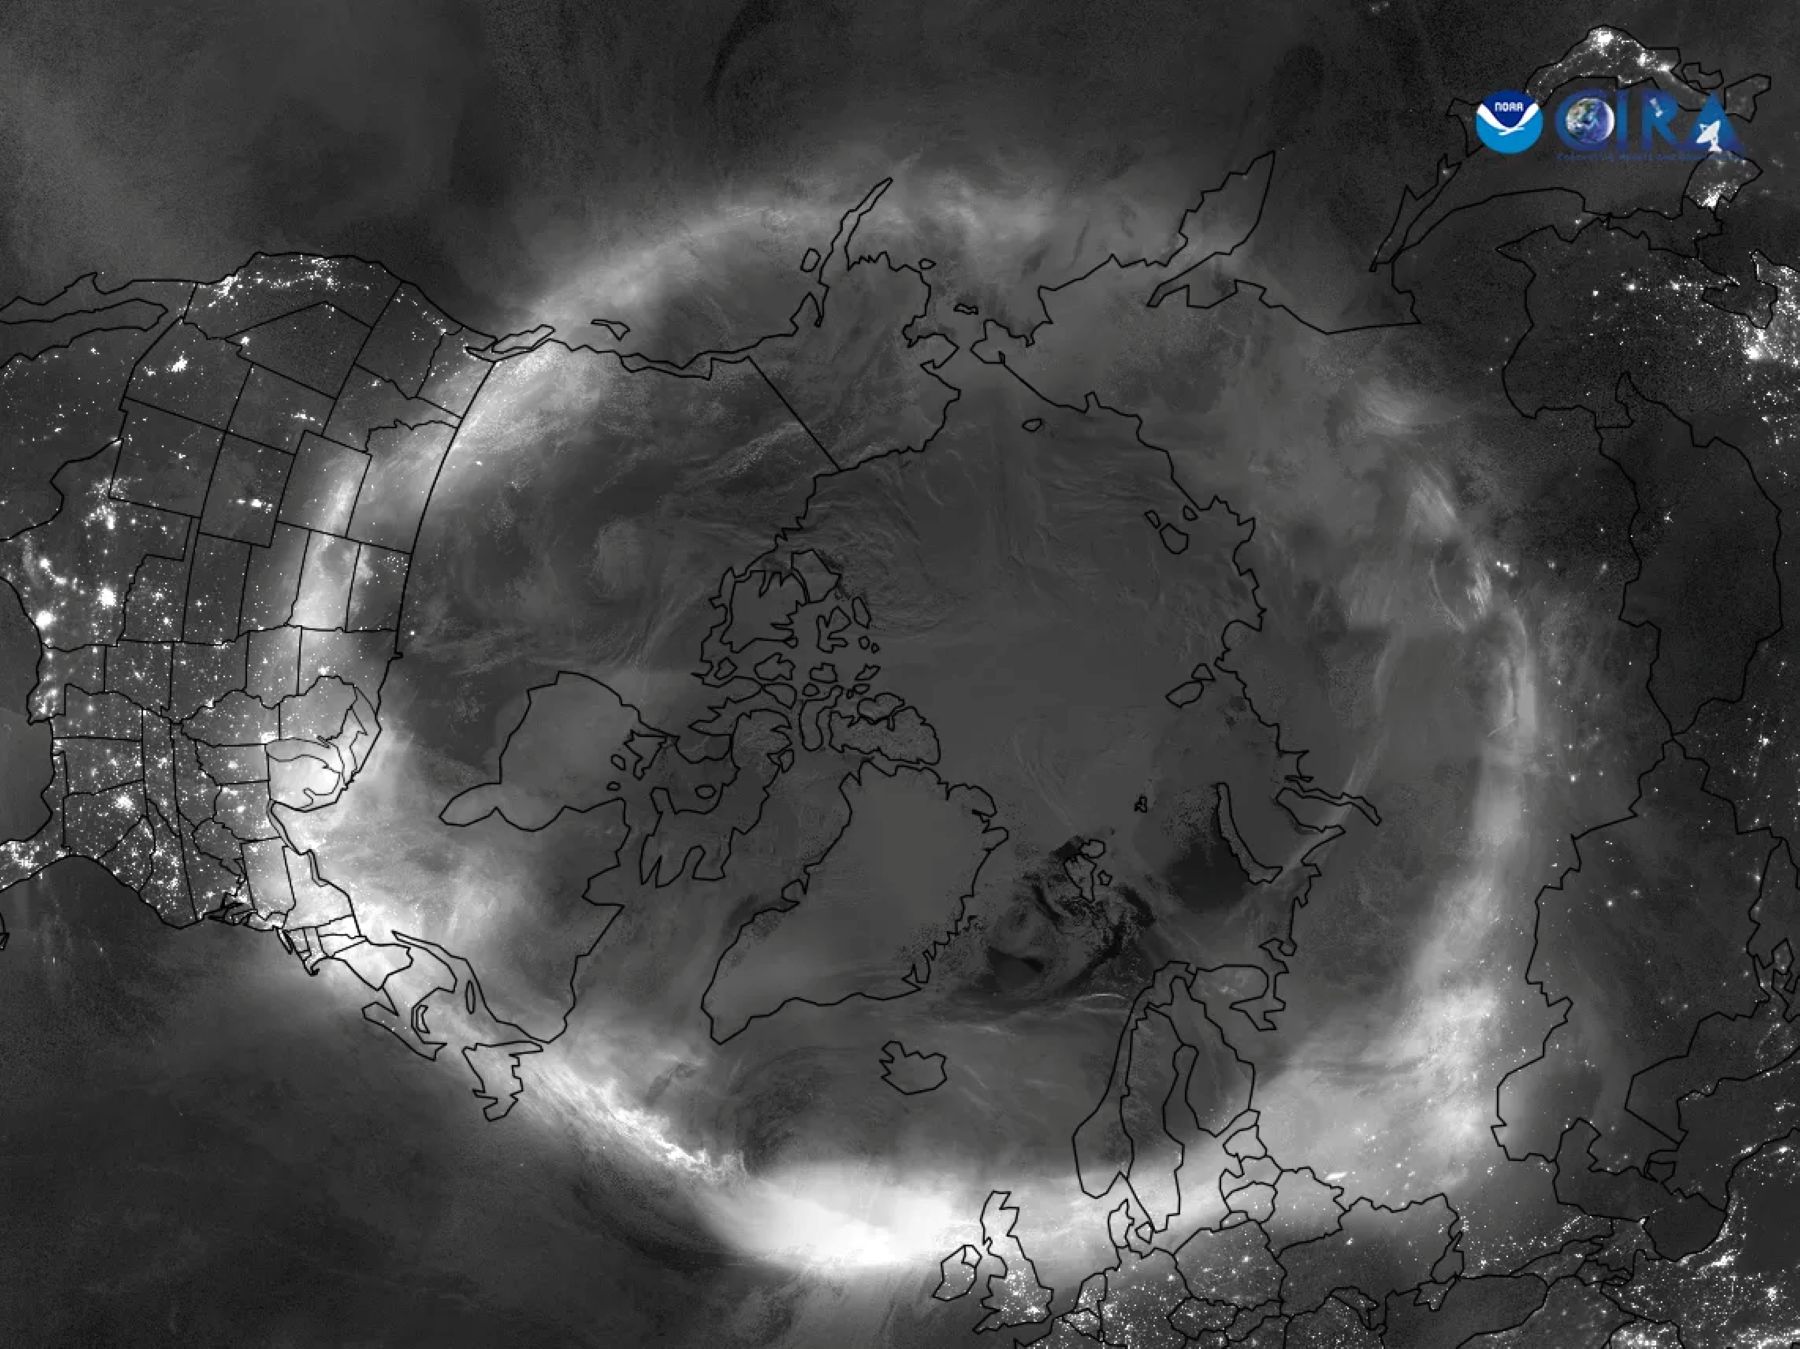
The colorful aurora borealis or Northern Lights and aurora australis or Southern Lights are created by the transfer of energy from solar electrons to molecules in Earth’s upper atmosphere. Those molecules then release that energy in the form of light. Different molecules create specific colors, such as green from oxygen.
Because Earth’s magnetic field directs solar electrons toward the poles, auroras typically are visible only at high latitudes, such as in Canada in the north and Australia in the south. But solar storms can send the lights into much lower latitudes. During a series of large solar eruptions in May 2024, for example, the display could be seen as far south as Texas and California.
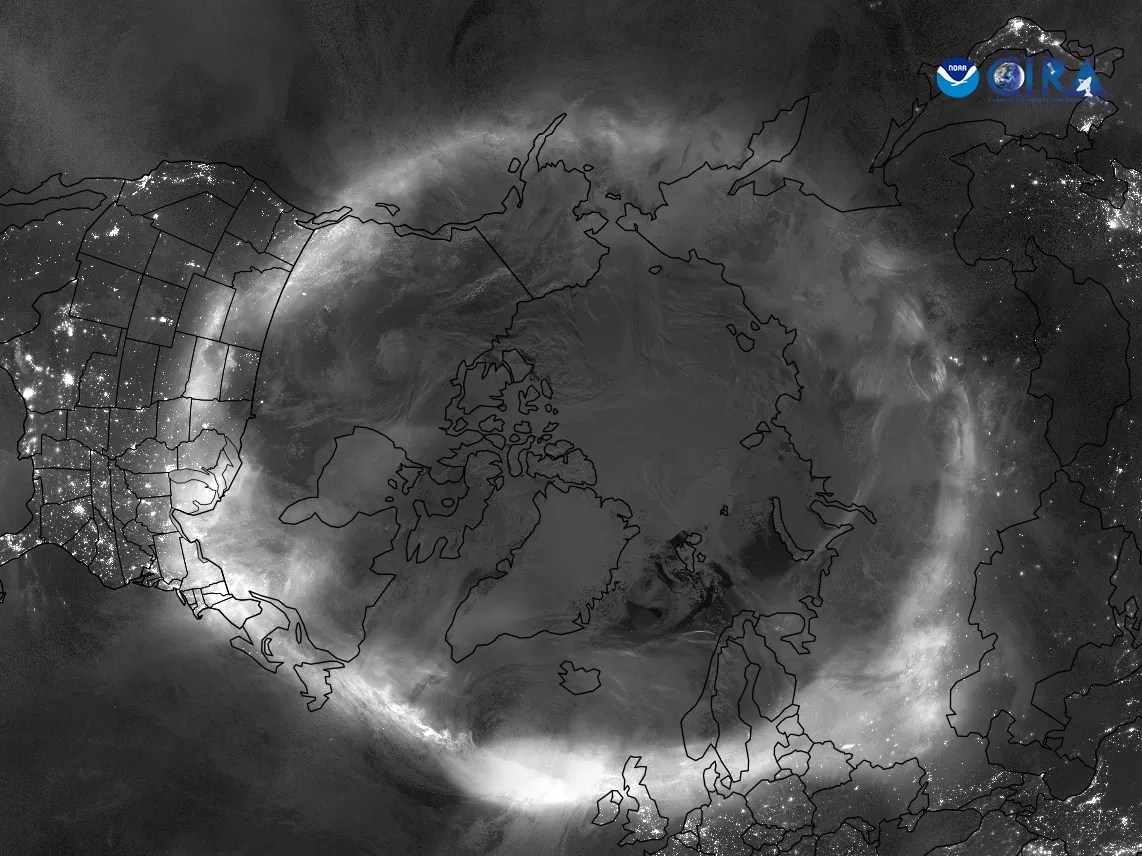
Satellites captured auroras visible across the globe on May 11, 2024.
NOAA
NASA has multiple missions studying how the Sun and solar storms affect Earth and space travel. The International Space Station contributes to this research in several ways.
Improved Solar Energy Measurements
The station’s Total and Spectral Solar Irradiance Sensor (TSIS) measures solar irradiance, the solar energy Earth receives, and solar spectral irradiance, a measure of the Sun’s energy in individual wavelengths. Knowing the magnitude and variability of solar irradiance improves understanding of Earth’s climate, atmosphere, and oceans and enables more accurate predictions of space weather. Better predictions could in turn help protect humans and satellites in space and electric power transmission and radio communications on the ground.
The first five years of TSIS observations demonstrated improved long-term spectral readings and lower uncertainties than measurements from a previous NASA mission, the Solar Radiation and Climate satellite. The accuracy of TSIS observations could improve models of solar irradiance variability and contribute to a long-term record of solar irradiance data.
Earlier Sun Monitoring
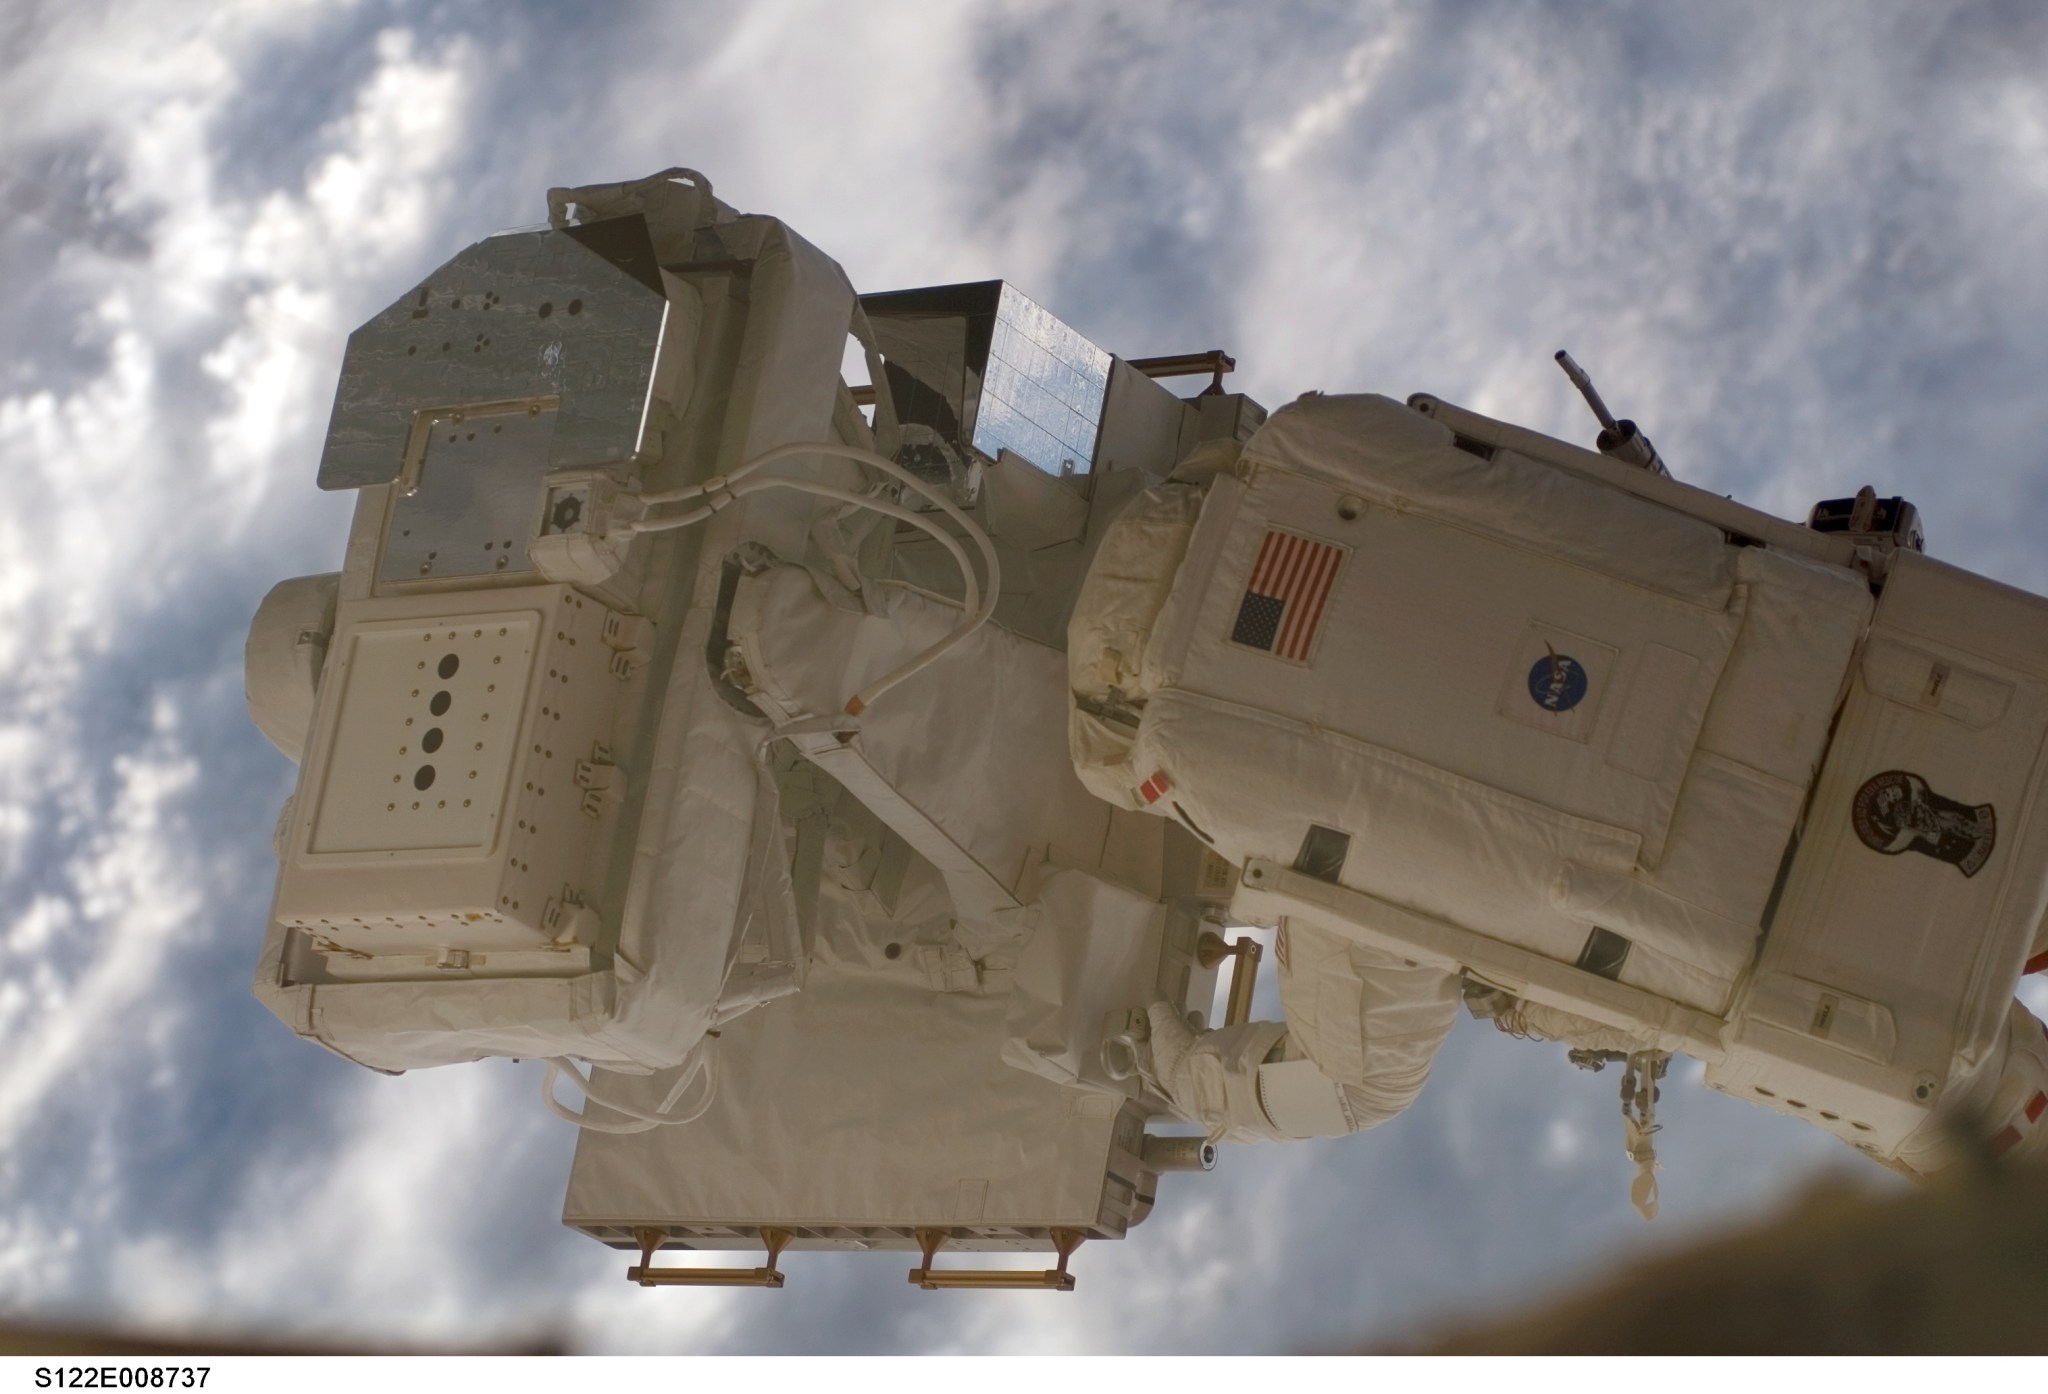
Installation of the Solar instruments on the space station during a spacewalk.
NASA
The ESA (European Space Agency) Sun Monitoring on the External Payload Facility of Columbus, or Solar, collected data on solar energy output for more than a decade with three instruments covering most wavelengths of the electromagnetic spectrum. Different wavelengths emitted by the Sun are absorbed by and influence Earth’s atmosphere and contribute to our climate and weather. This monitoring helps scientists see how solar irradiance affects Earth and provides data to create models for predicting its influence.
One instrument, the Solar Variable and Irradiance Monitor, covered the near-ultraviolet, visible, and thermal parts of the spectrum and helped improve the accuracy of these measurements.
The SOLar SPECtral Irradiance Measurement instrument covered higher ranges of the solar spectrum. Its observations highlighted significant differences from previous solar reference spectra and models. Researchers also reported that repeated observations made it possible to determine a reference spectrum for the first year of the SOLAR mission, which corresponded to a solar minimum prior to Solar Cycle 24.
Solar activity rises and falls over roughly 11-year cycles. The current Solar Cycle 25 began in December 2019, and scientists predicted a peak in solar activity between January and October of 2024, which included the May storms.
The third instrument, SOLar Auto-Calibrating EUV/UV Spectrometers, measured the part of the solar spectrum between extreme ultraviolet and ultraviolet. Most of this highly energetic radiation is absorbed by the upper atmosphere, making it impossible to measure from the ground. Results suggested that these instruments could overcome the problem of degrading sensitivity seen with other solar measuring devices and provide more efficient data collection.
Auroras from Space
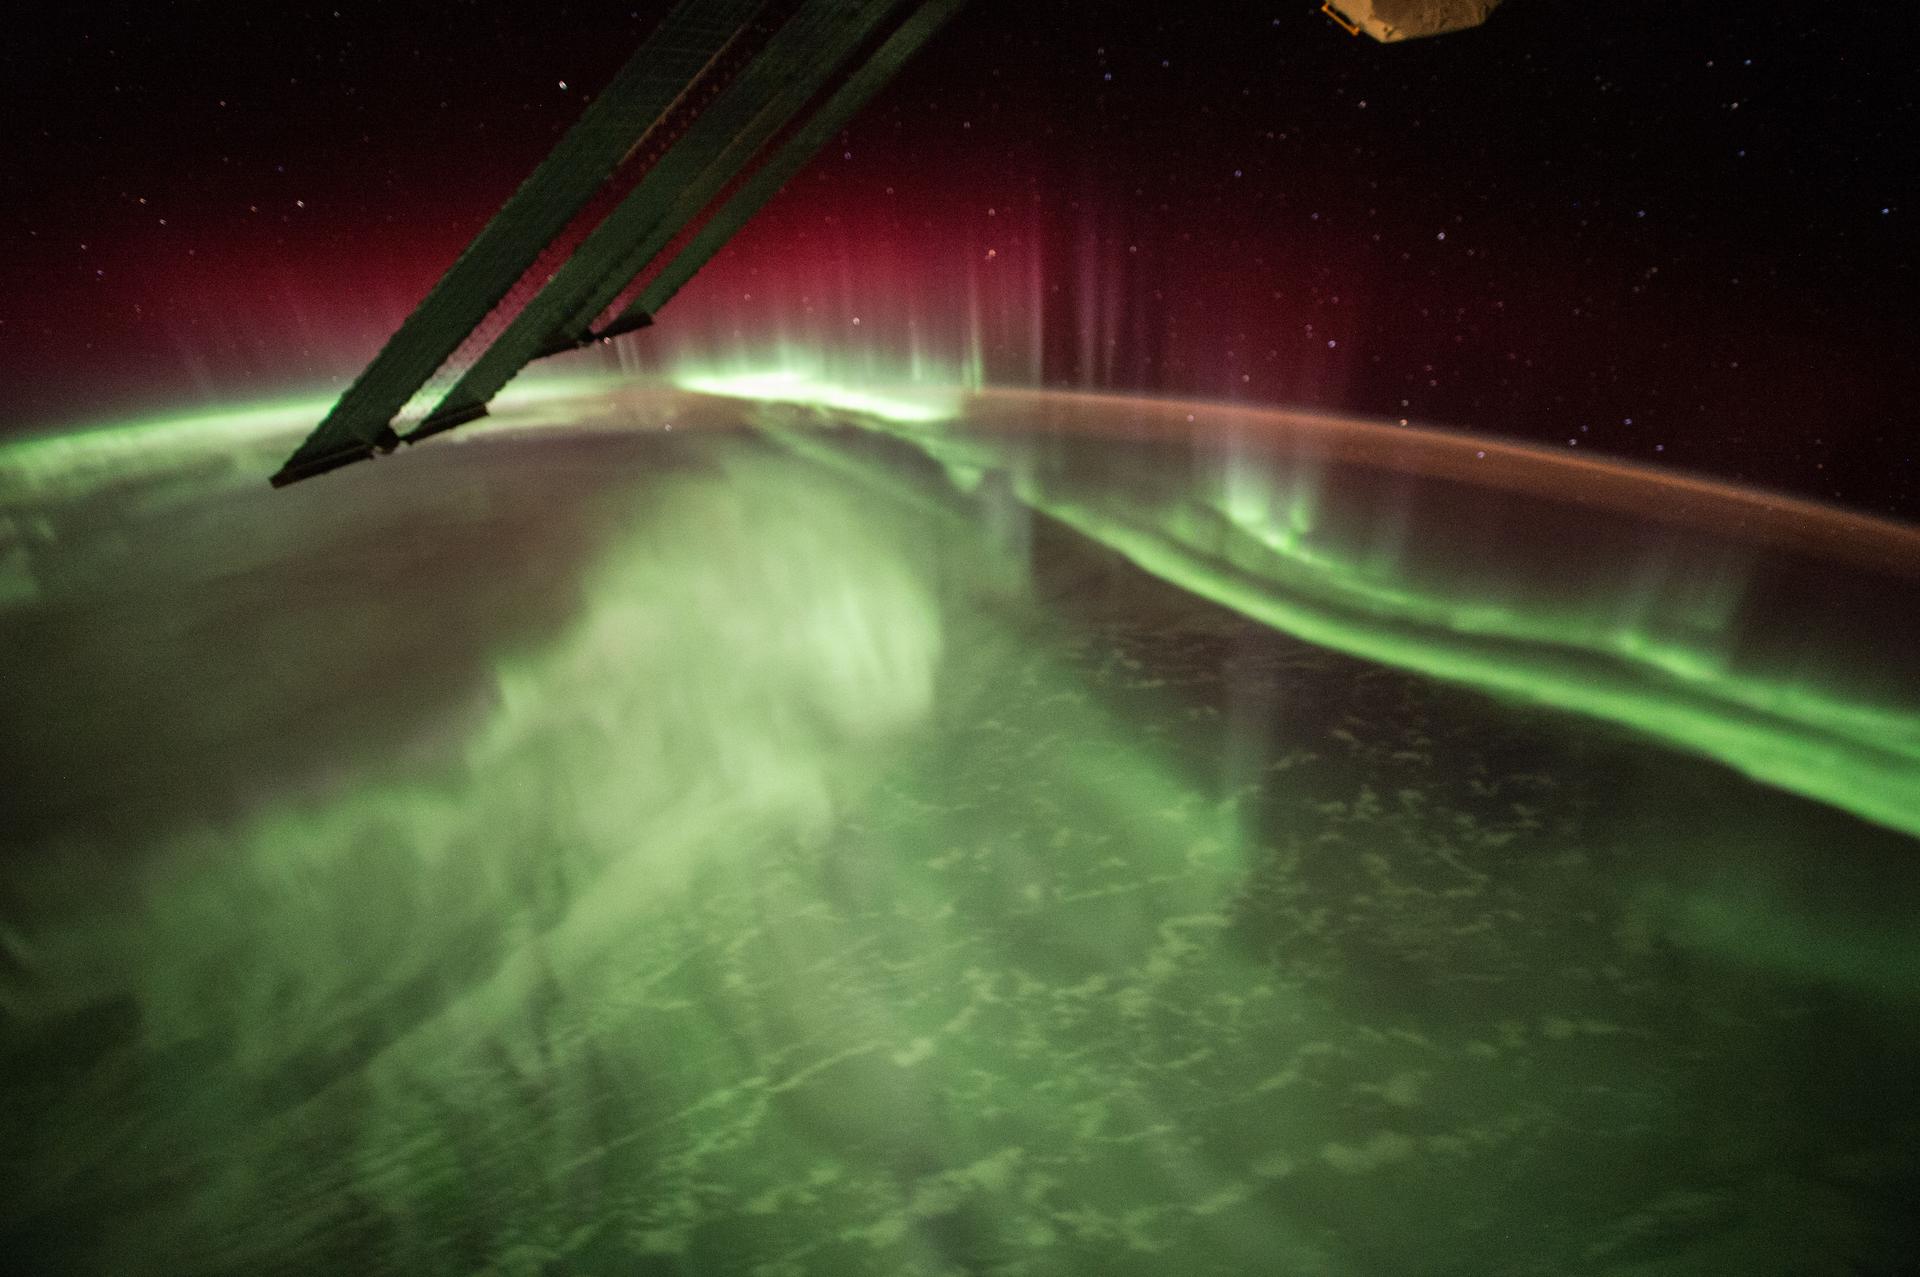
An aurora borealis display photographed from the International Space Station.
NASA
Astronauts occasionally photograph the aurora borealis from the space station and post these images.
For the CSA (Canadian Space Agency) AuroraMAX project, crew members photographed the aurora borealis over Yellowknife, Canada, between fall 2011 and late spring 2012. The space images, coordinated with a network of ground-based observatories across Canada, contributed to an interactive display at an art and science festival to inspire public interest in how solar activity affects Earth. The project also provides a live feed of the aurora borealis online every September through April.
Student Satellites
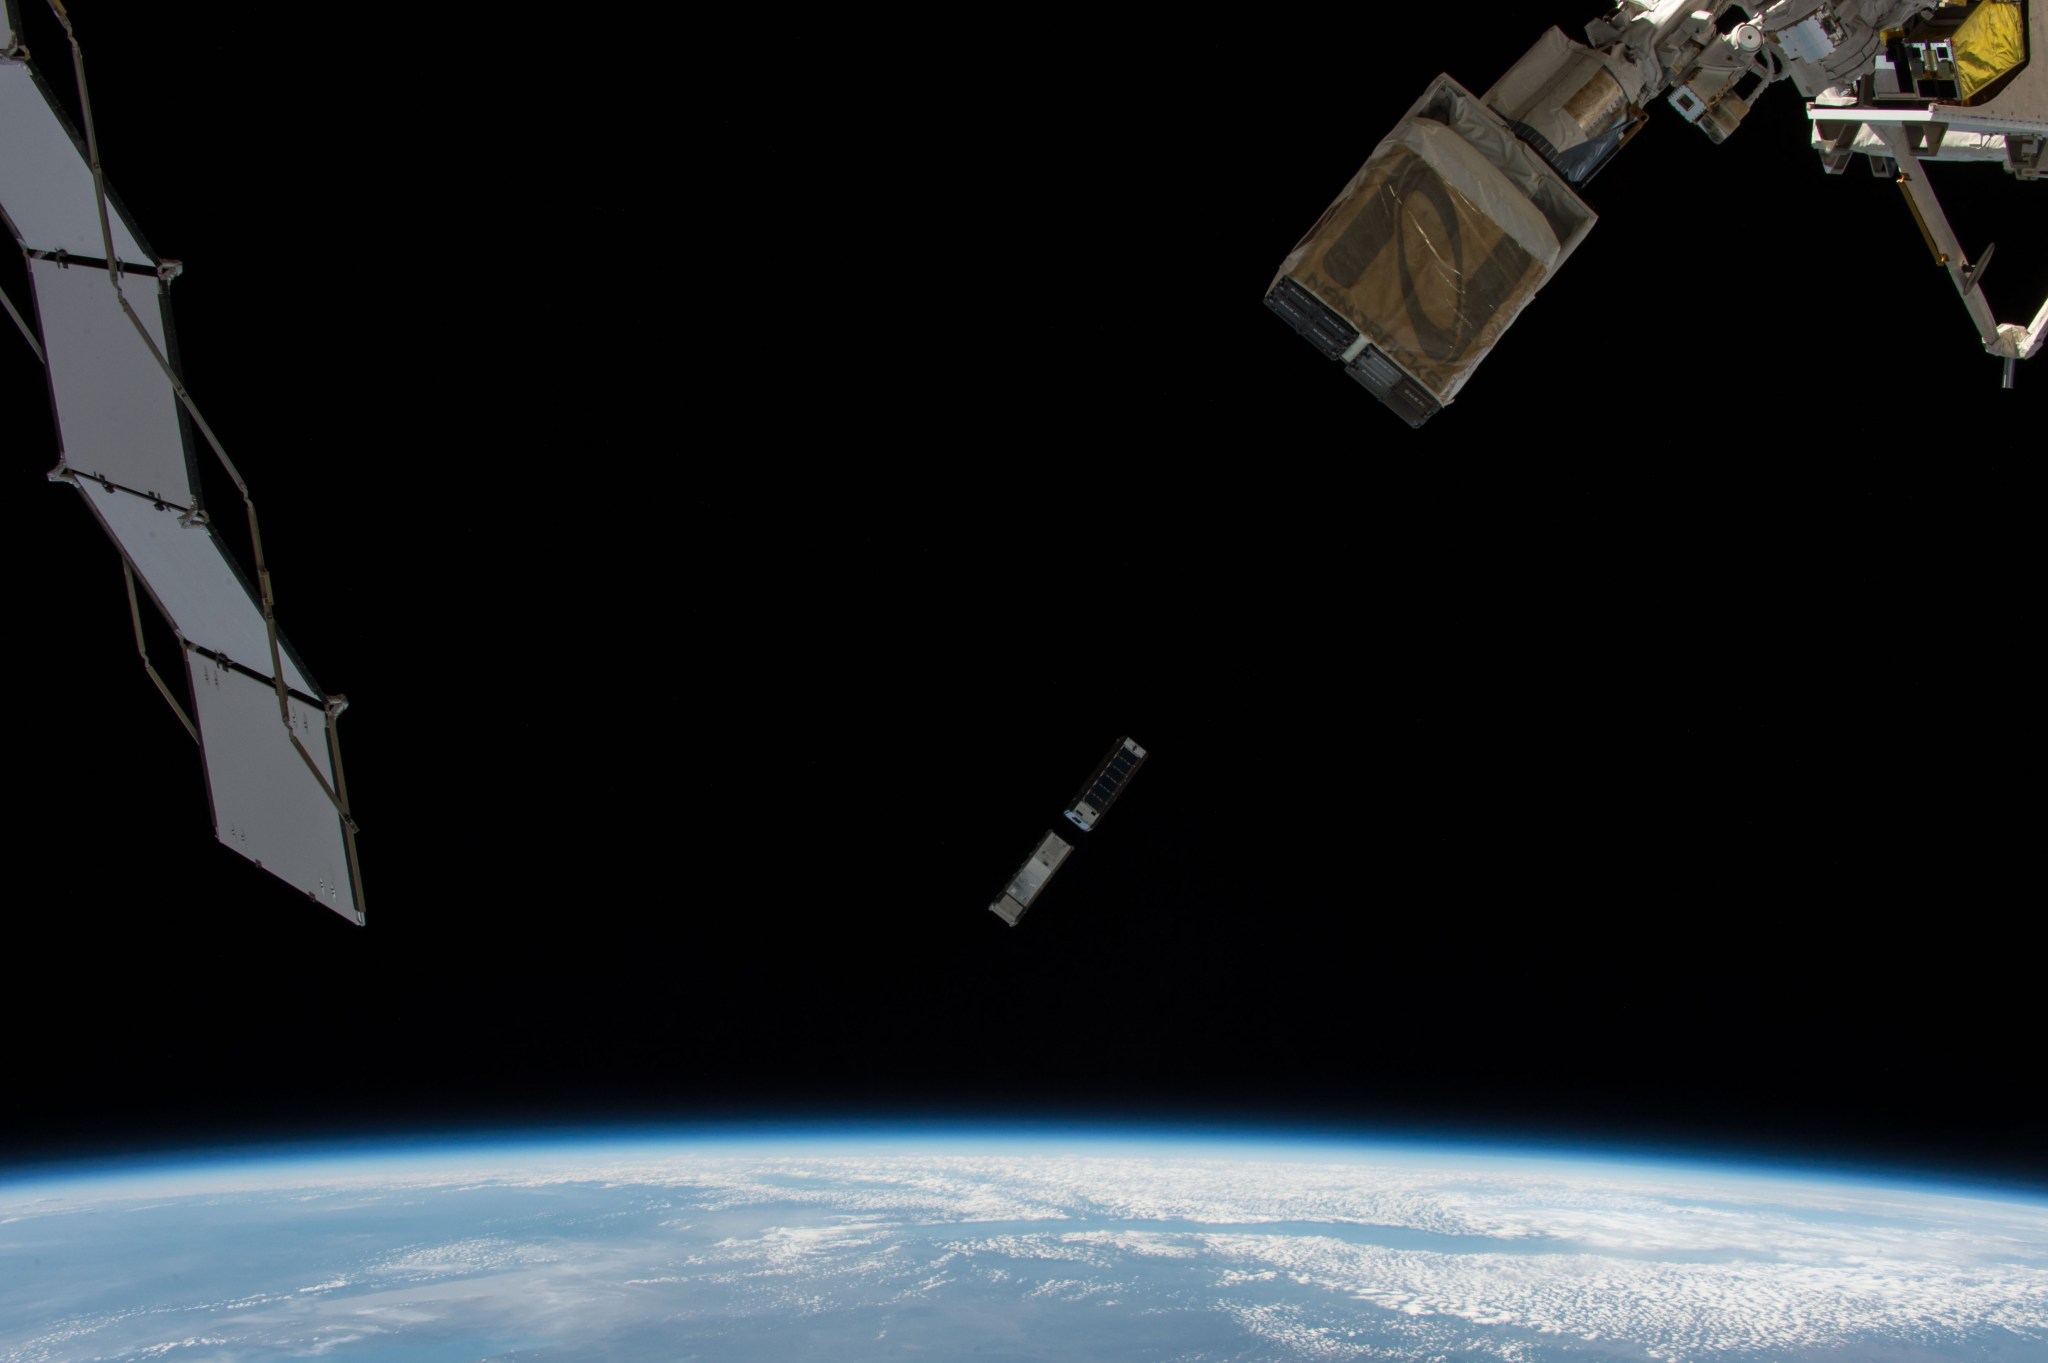
Deployment of the Miniature X-ray Solar Spectrometer and other CubeSats from the space station.
NASA
The Miniature X-ray Solar Spectrometer CubeSat measured variation in solar X-ray activity to help scientists understand how it affects Earth’s upper atmosphere. Solar X-ray activity is enhanced during solar flares. Students at the University of Colorado Laboratory for Atmospheric Space Physics built the satellite, which deployed from the space station in early 2016.
Better data help scientists understand how solar events affect satellites, crewed missions, and infrastructure in space and on the ground. Ongoing efforts to measure how Earth’s atmosphere responds to solar storms are an important part of NASA’s plans for Artemis missions to the Moon and for later missions to Mars.
Melissa Gaskill
International Space Station Research Communications Team
NASA’s Johnson Space Center
Search this database of scientific experiments to learn more about those mentioned above.


