


Sea ice at both the top and bottom of the planet continued its decline in 2024. In the waters around Antarctica, ice coverage shrank to near-historic lows for the third year in a row. The recurring loss hints at a long-term shift in conditions in the Southern Ocean, likely resulting from global climate change, according to scientists at NASA and the National Snow and Ice Data Center. Meanwhile, the 46-year trend of shrinking and thinning ice in the Arctic Ocean shows no sign of reversing.
“Sea ice acts like a buffer between the ocean and the atmosphere,” said ice scientist Linette Boisvert of NASA’s Goddard Space Flight Center in Greenbelt, Maryland. “Sea ice prevents much of the exchange of heat and moisture from the relatively warm ocean to the atmosphere above it.”
Less ice coverage allows the ocean to warm the atmosphere over the poles, leading to more ice melting in a vicious cycle of rising temperatures.
Historically, the area of sea ice surrounding the Antarctic continent has fluctuated dramatically from year to year while averages over decades have been relatively stable. In recent years, though, sea ice cover around Antarctica has plummeted.
On Feb. 20, 2024, Antarctic sea ice officially reached its minimum extent for the year. This cycle of growth and melting occurs every year, with the ice reaching its smallest size during the Southern Hemisphere’s summer. According to the National Snow and Ice Data Center, this marks the second-lowest sea ice extent recorded by satellites, reflecting a trend of declining coverage over time.
Credit: NASA’s Goddard Space Flight Center/Scientific Visualization Studio
Download this video in HD formats from https://svs.gsfc.nasa.gov/14538.
“In 2016, we saw what some people are calling a regime shift,” said sea ice scientist Walt Meier of the National Snow and Ice Data Center at the University of Colorado, Boulder. “The Antarctic sea ice coverage dropped and has largely remained lower than normal. Over the past seven years, we’ve had three record lows.”
This year, Antarctic sea ice reached its lowest annual extent on Feb. 20 with a total of 768,000 square miles (1.99 million square kilometers). That’s 30% below the 1981 to 2010 end-of-summer average. The difference in ice cover spans an area about the size of Texas. Sea ice extent is defined as the total area of the ocean in which the ice cover fraction is at least 15%.
This year’s minimum is tied with February 2022 for the second lowest ice coverage around the Antarctic and close to the 2023 all-time low of 691,000 square miles (1.79 million square kilometers). With the latest ice retreat, this year marks the lowest three-year average for ice coverage observed around the Antarctic continent across more than four decades.
The changes were observed in data collected with microwave sensors aboard the Nimbus-7 satellite, jointly operated by NASA and the National Oceanic and Atmospheric Administration (NOAA), along with satellites in the Defense Meteorological Satellite Program.
NASA’s Earth Observatory: Antarctic Sea Ice at Near-Historic Lows
Meanwhile, at the other end of the planet, the maximum winter ice coverage in the Arctic Ocean is consistent with an ongoing 46-year decline. Satellite images reveal that the total area of the Arctic Ocean covered in sea ice reached 6 million square miles (15.65 million square kilometers) on March 14. That’s 247,000 square miles (640,000 square kilometers) less ice than the average between 1981 and 2010. Overall, the maximum winter ice coverage in the Arctic has shrunk by an area equivalent to the size of Alaska since 1979.
This year’s Arctic ice maximum is the 14th lowest on record. Complex weather patterns make it difficult to predict what will happen in any given year.
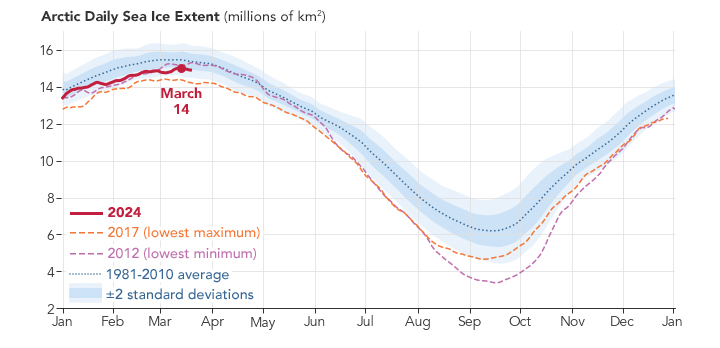
The Arctic Ocean sea ice reached its annual maximum on March 14, continuing the long-term decline in ice at the poles.
Chart by Lauren Dauphin/NASA Earth Observatory, using data from the National Snow and Ice Data Center.
Shrinking ice makes Earth more susceptible to solar heating. “The sea ice and the snow on top of it are very reflective,” Boisvert said. “In the summer, if we have more sea ice, it reflects the Sun’s radiation and helps keep the planet cooler.”
On the other hand, the exposed ocean is darker and readily absorbs solar radiation, capturing and retaining that energy and ultimately contributing to warming in the planet’s oceans and atmosphere.
Sea ice around the poles is more susceptible to the weather than it was a dozen years ago. Ice thickness measurements collected with laser altimeters aboard NASA’s ICESat-2 satellite show that less ice has managed to stick around through the warmer months. This means new ice must form from scratch each year, rather than building on old ice to make thicker layers. Thinner ice, in turn, is more prone to melting than multi-year accumulations.
“The thought is that in a couple of decades, we’re going to have these essentially ice-free summers,” Boisvert said, with ice coverage reduced below 400,000 square miles (1 million square kilometers) and most of the Arctic Ocean exposed to the Sun’s warming glare.
It’s too soon to know whether recent sea ice lows at the South Pole point to a long-term change rather than a statistical fluctuation, but Meier believes long term declines are inevitable.
“It’s only a matter of time,” he said. “After six, seven, eight years, it’s starting to look like maybe it’s happening. It’s just a question of whether there’s enough data to say for sure.”
Reference: NSIDC Sea Ice Index Daily and Monthly Image Viewer
Got a Questions?
Find us on Socials or Contact us and we’ll get back to you as soon as possible.